Data, particularly machine data, is a foundational component of every smart factory or OEE initiative. It fuels analytics, triggers actions ahead of problems or shutdowns, and provides insight for continuous improvement. Many companies start the smart factory journey with an automated OEE system because it’s a natural progression with a set of metrics they’re already familiar with. Despite advances in automated data collection and production analytics, a lot of manufacturing executives are still at odds about exactly which machine data is required to calculate OEE. Unfortunately, a lot of projects get sidetracked early on as stakeholders try to utilize every piece of machine-generated data from the multitude available. A more pragmatic approach is to apply machine data based on priorities around business goals. To that end, capturing the machine data required for OEE is a critical early activity for most smart factory initiatives.
Real-World Use Case to Use Machine Data to Feed OEE
Let’s consider the case of one company that makes parts for heavy equipment and has many CNC machines. Two years ago, I was helping that organization with their machine connectivity efforts. The firm wanted to implement a manufacturing execution system (MES) to help its people minimize machine downtime and improve operational efficiency. These efforts would improve margins, which was the main business goal. The company needed to capture machine data to feed the MES.

During project planning, the senior executives looked to every department to define what data each most wanted from the machines. The result was an overwhelming list of data points, many of which didn’t directly feed the most basic metrics, particularly OEE. The team was in danger of slowing down or stalling the project altogether because it was trying to juggle too much data, and without any specific reason or use for most of the data points. At that juncture, I made the recommendation to take a step back, decide which data points were the “right” machine data to feed OEE, and capture only those for the first phase of the project.
What Constitutes the “Right” Machine Data for OEE?
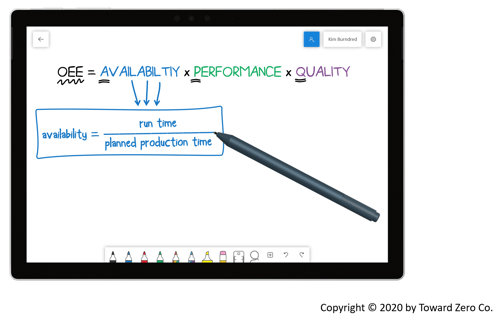
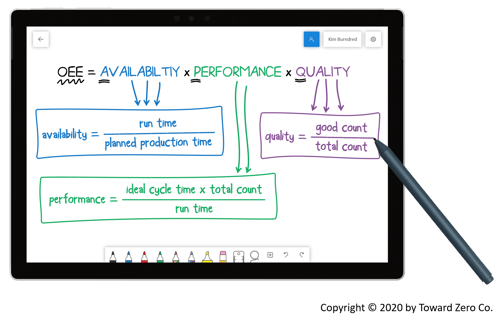
It’s often difficult for cross-functional teams to achieve consensus around which machine data is required for OEE. That’s surprising because almost everyone in manufacturing can articulate the basic OEE calculation: AVAILABILITY x PERFORMANCE x QUALITY (A x P x Q). Beyond that, getting to the three basic elements even manually can be a bit dicey. Machine makers aren’t thinking about OEE when they decide which data points to expose. In fact, many of them take a shotgun approach and expose everything — which results in potentially hundreds of data points. Then, when the machine is in use at the factory, it’s not immediately obvious which of those data points you can use to calculate OEE.
However, when we examine the formula elements closely, we can associate machine data from any manufacturing equipment for OEE, even if it’s an older factory machine. That’s not to say that raw machine data goes directly into the OEE calculation; sometimes combining signal states into meaningful operational states is an important process (this is also known as signal normalization). Together, machine-generated data and signal normalization feed the OEE metric. Any organization can achieve consensus about the right machine data for OEE by breaking down and considering the three distinct OEE components.
Availability
To calculate AVAILABILITY, divide machine runtime by planned production time.
Establish machine run time using basic machine signals: cycle, hold, mode, spindle (normalized)
- Determine planned production time by subtracting break times (breaks, lunches, meetings, etc.) from total available time during shift; no machine data required for this element)
- Determine total production time by normalizing the raw data points: cycle active, mode automatic, spindle running, and hold inactive
Performance
Calculate PERFORMANCE by multiplying ideal cycle time and total count, then dividing that figure by runtime.

- The ERP system provides ideal cycle time, which initially comes from engineering and then fine-tuned with data from multiple production runs
- Total count is the part count signal from the machine
- Use the machine runtime figure described above
Companies don’t need other signals to feed the performance part of the OEE calculation. However, data about anything that causes the manufacturing process to run at less than the maximum possible speed is relevant. More importantly, the true power of OEE is identifying and resolving reasons for performance loss. Therefore, feed rate and spindle override are extremely valuable data points, but not specifically required for the OEE calculation.
Quality
Calculate QUALITY by dividing good parts by total produced.
- Use a “good” count signal for the first factor. Some machines have a probe to measure the finished part for pass/fail quality at the end of the machining process. In the absence of machine data for good parts, an operator checks each part and enters the data manually.
- For the second factor, use the number of reject parts
In most cases, plants conduct parts inspection as a separate process, sometimes away from where the part is produced. In this scenario, the company can’t apply the quality element of the OEE formula until someone completes the parts inspection.
Best Practices in Capturing Machine Data for OEE and the Smart Factory
If your company is already collecting machine data but not using the OEE metric, it already understands that where machine connectivity is concerned, the benefits far outweigh the challenges. Or, perhaps your organization uses a different formula to monitor performance but struggles to identify and resolve reasons for performance loss. These manufacturers, like those just getting started with machine connectivity can benefit from breaking down and considering the three distinct OEE components. Regardless of where your organization is in terms of capturing and using applying machine data for OEE and the smart factory, these best practices will help your team get the right data and apply it properly:
- Avoid the “all data possible” syndrome. Determine exactly what data is needed for OEE, along with specific data points to uncover reasons for performance loss. Once your company has achieved all possible performance improvements from that data, that’s the time to consider additional goals and adding data points to support them.
- Include operations technology in the process from the start and enlist their help for data normalization.
- Don’t skip older machines just because they don’t have the same data capabilities as your newer equipment. There are companies and consultants that specialize in machine data and machine connectivity and have the know-how to capture data from older equipment quickly and cost-efficiently.
- A smart data collection device will capture plenty of raw data points that can be normalized into meaningful production and downtime representations. This makes your older ‘legacy’ machines viable for OEE.
- Don’t forget that machine overrides affect production rates. Capture machine overrides for spindle and feed rate to generate valuable metrics for OEE.
- Control / limit operator ability to edit program to uphold ISO9000 certification. The ability to lock and unlock program edit capability at the controller digitally along with removing the edit key altogether provides traceability for all program edits and ensures proper revision methodologies.
- Consider “location, location, location” and normalize raw machine data as close to the hardware layer as possible, to provide flexibility to easily switch MES solutions down the road or even use multiple MES packages simultaneously.
Topics discussed

Related Posts


Subscribe to Our Blog
Get the latest best practices and insights sent directly to you. (We promise, no automated marketing messages.)